Financial Tools
Making Sense of Your Home Health Agency’s Financial Reports: Worksheets to Analyze Your Gross Profit & Margin by Cost Per Visit and Payer or Program
08/10/2018
In my last post, we demonstrated how to calculate and evaluate gross profit in your agency. In this post, we look deeper at gross profit by type of service (or discipline) and do this analysis by payer of services.
Need a refresher? You can review my initial “how to calculate GPM” post here.
You may also view and download two handy worksheets below. But first, let’s review some basics.
Benefits of doing a GPM-by-CPV and GPM-by-Payer Analysis
It’s important to first understand your gross margin one or two levels deep – e.g. by type of service or discipline and by the payer of the services.
Look at specific payer information prior to renewing or renegotiating a contract. Know your profit dollars by detail. When negotiating, perhaps you don’t need an increase on physical-therapy but you must get one for home health aides. Or, perhaps you are not concerned with the therapy rates but really need an increase for your skilled nursing rates.
How much gross margin do you need? One answer is “As much as I can get”. But it’s essential to know the absolute requirements.
Look at Fixed & Semi-Variable Costs
Previously we discussed variable or direct costs, which increase or decrease relative to our business volume. Here we need to look at fixed costs – also labeled G&A, overhead, indirect costs, or whatever your accounting or finance department calls them. These include all costs that don’t change that much – either they are fixed (only increase once a year or more) or they are “semi-variable” and increase at certain steps in the growth (or decline) of the agency. Examples would include rent, telephone, office supplies, and management payroll. As examples, you would see increases (or decreases) in these expenses when you experience significant growth in census, or when you expand (or reduce) a certain program or decide not to accept a certain payer any longer.
A straightforward example: if you have $1,000,000 in gross profit and $900,000 in “fixed-type” expenses, then you have $100,000 of operating profit. Operating profit or operating income is the amount of profit (or loss) from operating activities. There may be other costs (or income) that are not directly related to operating activity that would be deducted or added to operating income to get to your net income (or loss). The net income (or loss) is your bottom line.
On the other hand, if you have $1,200,000 of fixed-type of expenses and $1,000,000 of gross profit dollars available to pay for them, you have an operating loss of $200,000.
The other way to look at this is to review your gross margin percentage. If your gross margin percentage is 30% of revenues and all of your fixed-type expenses add up to 32% of revenue, then you have a 2% operating loss.
Please focus on what you can do something about – control your gross profit! Be sure that you aren’t letting gross profit slip thru the cracks. It’s easy to let gross profit slide. The good news is that with the proper information, we can manage it.
Gross Profit MUST cover remaining expenses and leave something for profit!
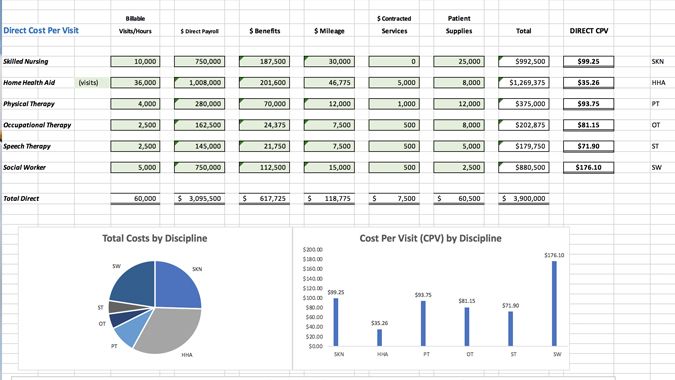
Spreadsheets to get you started
Once you have your cost per visit (CPV) you can start to evaluate your profitability by Payer. In the second spreadsheet, you can see an example of how this is calculated. By inserting the contracted net reimbursement rates for each payer, you can calculate the gross margin by discipline. You will likely find this very revealing. This is the perfect tool to use in your negotiations with payers. This will help you truly understand where you are making enough margin and where you are not covering the remainder of your costs.
Need support estimating your CPV and GM by Payer by Discipline? Reaching conclusions and/or taking action based on what your numbers reveal? Contact us at info@corcoranconsultants.com or call 207-251-9661.
Click to download and plug your agency’s numbers into each schedule:
Are you ready?
Sign Up For Our Monthly Insights
Sign up for our e-newsletter and receive valuable insights for your care at home organization.
Schedule An In-Person Meeting
For those who are ready to meet face to face, and talk seriously about analyzing the financial operations of their agency.
Schedule A Virtual
Meeting
For those who aren't ready to meet face to face in-person but want to talk seriously about the financial operations of their agency.